Thanks to our Sponsor:

Advanced Weather Insights for Agriculture and Beyond
FREE Predictive Precipitation Models for Canada & USA
Understand not just “if” it will rain, but the range of possible outcomes—helping you prepare for both the best and worst-case scenarios.
Want to learn More about Weather Models?
Access our free online course which explains how these models are created and how to interpret them. You'll also find free access to additional weather prediction models for temperature, long range trends, and more.
How to Use these Models
The maps below show predicted precipitation at the 10th, 50th, and 90th percentiles—representing the range of possible outcomes from an ensemble of weather models:
- 50th percentile: most likely precipitation amount (half of all models predict more, half predict less, so this is the sweet spot!)
- 10th percentile: possible least precipitation scenario (only 10% of models predict less)
- 90th percentile: possible wettest scenario (only 10% of models predict more)
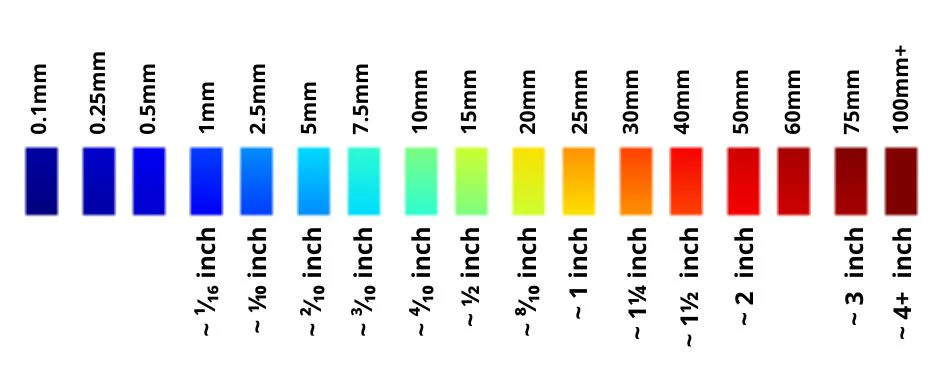
Click or tap on the map to view the actual predicted amounts in mm in the value_0 attribute. In the example below, 42.9 mm is predicted at the tapped location:

Expect conditions near the 50th percentile, but be aware that actual amounts could fall anywhere between the 10th and 90th—especially in uncertain weather systems.
Select Agricultural Region
Choose a region to focus the maps on primary agricultural areas.
Most Likely Precipitation (50th Percentile) [mm]
This map shows the most likely 48-hour accumulated Precipitation forecast (50th percentile) in millimeters (mm) from the Canadian Regional Ensemble Prediction System.
Possible Least Precipitation (10th Percentile) [mm]
This map shows the possible least 48-hour accumulated Precipitation (10th percentile) in millimeters (mm) forecast from the Canadian Regional Ensemble Prediction System.
Possible Most Precipitation (90th Percentile) [mm]
This map shows the possible highest 48-hour accumulated Precipitation (90th percentile) in millimeters (mm) forecast from the Canadian Regional Ensemble Prediction System.
Probability of Exceeding 5 mm Precipitation [%]
This map shows the probability (in percent) that the 48-hour accumulated Precipitation will exceed 5 mm (~²⁄₁₀"), based on the Canadian Regional Ensemble Prediction System.
Probability of Exceeding 10 mm Precipitation [%]
This map shows the probability (in percent) that the 48-hour accumulated Precipitation will exceed 10 mm (~⁴⁄₁₀"), based on the Canadian Regional Ensemble Prediction System.
Probability of Exceeding 25 mm Precipitation [%]
This map shows the probability (in percent) that the 48-hour accumulated Precipitation will exceed 25 mm (~1"), based on the Canadian Regional Ensemble Prediction System.
Probability of Exceeding 50 mm Precipitation [%]
This map shows the probability (in percent) that the 48-hour accumulated Precipitation will exceed 50 mm (~2"), based on the Canadian Regional Ensemble Prediction System.
🌧️ Free Precipitation Forecast Maps for Farmers and Agronomists
Plan with Confidence Using Percentile-Based Rainfall Forecasts
At GIS4Ag, we’re making it easier for growers and ag professionals to make data-driven decisions by providing free precipitation forecast maps—no login required, no strings attached.
These maps are built using Environment and Climate Change Canada’s Regional Ensemble Prediction System (REPS), a trusted weather model that uses multiple simulations to capture a full range of possible weather outcomes.
High Precision Forecasts
Utilize cutting-edge technology to receive highly accurate precipitation predictions.
Threshold Exceedance
Stay informed with maps on potential precipitation events exceeding critical thresholds.
Regional Specificity
Access forecasts tailored to specific regions across Canada and the USA.
User-Friendly Interface
Navigate easily with an intuitive interface designed for farmers and consultants.
Understanding Our Methodology
📊 What Do the Forecast Maps Show?
Multiple times each day, you’ll find updated maps showing predicted 12-hour, 24-hour, 48-hour, and 72-hour precipitation (rainfall or snow-rain equivalent) amounts across North America. We display:
50th Percentile
Most Likely Precipitation (50th Percentile)
The median forecast—what most models agree is the likeliest amount of rainfall. If you were a betting person, this would be where you should put your money!
10th Percentile
Possible Minimum Precipitation (10th Percentile)
A drier scenario that shows what could happen if storms underperform. About 10% of model runs predict less rain or snow than this, meaning it is unlikely you’ll get less than this shows.
90th Percentile
Possible Maximum Precipitation (90th Percentile)
A wetter scenario, showing what could happen if conditions intensify. About 10% of model runs predict more rainfall or precipitation than this, meaning its unlikely you’ll get more than shown here.
Probability of Exceeding 5, 10, 25, and 50 mm Rainfall
Maps showing the chance (%) that rainfall will exceed a certain threshold, helping you evaluate risk vs. reward for seeding, spraying, or harvesting.
🌎 Focused on Key Agricultural Regions
With just a click, you can zoom into Canadian Prairies, Ontario & Quebec, the U.S. Midwest, Southern Plains, and more—letting you quickly check the forecast for your area.
Seeding Timing
Fungicide application planning
Nutrient management
Harvest risk assessments
💡 Why Ensemble Forecasts Matter
Unlike a single forecast, ensemble systems like REPS run multiple simulations to account for uncertainty in the atmosphere. The result: you get a range of possible outcomes, not just one guess.
This helps you:
-
Plan for the most likely outcome
-
Prepare for extremes (both dry and wet)
-
Make smarter risk-based decisions
🌧️ How Much Rain Will It Rain? Get Accurate, Free Rainfall Forecasts by Region
Wondering how much rain you’ll get this week in your area? Our interactive forecast maps help you answer exactly that—with percentile-based rainfall forecasts from Environment Canada’s REPS model, trusted by meteorologists and ag professionals across North America.
🔍 How Much Rain Will I Get? Check Rainfall Forecasts by Region:
Searches like how much rain will I get in Manitoba today? or rainfall forecast Alberta tomorrow are what this tool is built for. You’ll find custom views that zoom into the most agriculturally important regions in both Canada and the United States:
🇨🇦 Canada
-
Manitoba rainfall forecast – Prairie-focused views for field-scale decision making
-
Saskatchewan rainfall forecast – See how much rain will fall in Regina, Moose Jaw, or your rural area
-
Alberta rainfall forecast – Know whether to pause seeding or spray before the system hits
-
Ontario rainfall forecast – Forecast maps for Ottawa, London, Windsor, and everywhere in between
-
Quebec rainfall forecast – Plan around rainfall in Montreal, Quebec City, or rural regions
🇺🇸 United States
-
North Dakota rainfall forecast – Track moisture timing across Red River Valley farms
-
South Dakota rainfall forecast – Know whether a thunderstorm could help (or halt) your fieldwork
-
Minnesota rainfall forecast – Be ready for wet or dry conditions around the Twin Cities and beyond
-
Iowa rainfall forecast – One of the most searched: How much will it rain in Iowa this week?
-
Illinois rainfall forecast – From Peoria to the plains, get precise precipitation estimates
-
Nebraska rainfall forecast – Use real model data to plan irrigation or fertilizer
-
Kansas rainfall forecast – Forecast tools for the heart of wheat and corn country
-
Missouri rainfall forecast – See if storms will affect your planting or harvest schedule
-
Indiana rainfall forecast – Protect your window for spraying or sidedressing
-
Ohio rainfall forecast – Avoid surprises with full-range precipitation probabilities
-
Texas rainfall forecast – From Lubbock to Houston, track chances of major rainfall
-
Oklahoma rainfall forecast – Percentile forecasts that give more insight than single estimates
-
Arkansas rainfall forecast – Great for rice, cotton, and soybean planning
-
Georgia rainfall forecast – Forecast rain before applying N or protecting fruit crops
-
Mississippi rainfall forecast – Know when to delay or press ahead
-
California rainfall forecast – Check rain potential even in low-precip regions
-
New York rainfall forecast – Includes upstate ag regions and beyond
📈 Know the Range: Not Just “If” It Will Rain—But How Much
Most weather apps give you a single number or chance of rain. We go deeper.
Our maps show:
-
Most likely rainfall (50th percentile)
-
Worst-case dry scenario (10th percentile)
-
Possible maximum rainfall (90th percentile)
-
Probability of exceeding key thresholds (5 mm, 10 mm, 25 mm, 50 mm)
This gives farmers, agronomists, and land managers the power to prepare for the full range of possible rainfall outcomes.
✅ Designed for Farming and Field Operations
Whether you’re deciding when to:
-
Seed or plant
-
Spray fungicide or herbicide
-
Side-dress nitrogen
-
Harvest or swath
-
Delay fieldwork due to mud or rain risk
These interactive rainfall forecast maps help you time your operations with confidence—for free, with no subscription, straight from GIS4Ag.com.
Disclaimer
The precipitation forecast maps provided on this page are for informational and planning purposes only. While the data is based on reputable sources, including Environment and Climate Change Canada's Regional Ensemble Prediction System (REPS), GIS4Ag.com makes no guarantees regarding accuracy, completeness, or timeliness of the forecasts displayed.
Users should be aware that all weather forecasts carry inherent uncertainty, and actual conditions may differ from those predicted. GIS4Ag.com and its owners accept no responsibility or liability for any decisions, actions, or losses resulting from the use or interpretation of this information.
By using this page, you acknowledge and agree that the information is provided “as is” without any warranties and that you use it at your own risk.