
Lesson 2: Understanding Percentiles in Weather Forecasts
Lesson 2: Understanding Percentiles in Weather Forecasts and Their Significance in Interpreting Data
Objective: To provide an understanding of percentiles in weather forecasting, explain how they are used, and illustrate their significance in interpreting weather data effectively.
Weather forecasts are essential tools that help individuals and organizations make informed decisions about their daily activities and long-term planning. One of the key concepts in modern weather forecasting is the use of percentiles to convey information about the range of possible weather outcomes. Understanding percentiles is crucial for interpreting forecast data accurately and assessing the likelihood of various weather scenarios.
2.1 Introduction to Percentiles
Percentiles are statistical measures used to indicate the value below which a given percentage of observations in a group falls. In the context of weather forecasting, percentiles help describe the distribution of possible weather conditions predicted by ensemble models. They provide insights into the range and likelihood of different weather outcomes, enabling users to understand not just the most probable forecast but also the potential variability around it.
For example, the 50th percentile (also known as the median) represents the middle value of the forecast distribution, where half of the predictions are lower and half are higher. The 10th and 90th percentiles represent values below which 10% and 90% of the observations fall, respectively. These percentiles help illustrate the uncertainty and spread within the forecast data.
Understanding percentiles is essential because weather is inherently uncertain, and forecasts are not absolute predictions. Percentiles offer a way to quantify this uncertainty and provide a more comprehensive picture of possible future conditions. The rainfall predictions included in this online tool are provided at different percentiles in order to give you a better understanding of the likely scenarios that may play out.
2.2 The Role of Ensemble Models in Generating Percentiles
Ensemble models, as discussed in the previous lesson, generate multiple forecasts by running the same weather model several times with slight variations in initial conditions or model parameters. This approach acknowledges the inherent uncertainties in weather prediction due to factors like incomplete data, measurement errors, and the chaotic nature of the atmosphere.
Each run of the model, known as an ensemble member, produces a possible future state of the atmosphere. Collectively, these ensemble members create a distribution of forecasts that can be statistically analyzed to determine percentiles.
For instance, if an ensemble model runs 20 simulations, the outputs can be sorted from lowest to highest values for a particular weather variable, such as temperature or precipitation. The percentiles are then calculated based on this ordered list. The 50th percentile is the middle value, the 10th percentile is the value below which 10% of the simulations fall, and so on.
By examining these percentiles, forecasters and users can assess the range of possible weather outcomes and the confidence level of the predictions.
2.3 Interpreting Percentiles in Weather Forecasts
Interpreting percentiles requires an understanding of what each percentile represents and how it relates to potential weather conditions.
2.3.1 The 50th Percentile (Median)
The 50th percentile is the median value of the forecast distribution. It represents the most likely outcome based on the ensemble simulations. In practical terms, there is a 50% chance that the actual weather variable (e.g., rainfall amount) will be less than or equal to the 50th percentile value and a 50% chance it will be greater. Think of it like your best odds of winning at the casino!
Example: If the 50th percentile forecast for 24-hour accumulated rainfall is 10 mm, it means that half of the ensemble members predict rainfall amounts of 10 mm or less, and the other half predict amounts greater than 10 mm.
2.3.2 The 10th and 90th Percentiles
The 10th and 90th percentiles represent the lower and upper bounds of the forecast distribution, respectively.
- 10th Percentile: Indicates a lower-end scenario. There is a 10% chance that the actual value will be less than or equal to this percentile. It represents a drier or cooler scenario in precipitation or temperature forecasts.
- Example: A 10th percentile rainfall forecast of 2 mm suggests that there is a 10% chance of receiving 2 mm or less of rain.
- 90th Percentile: Indicates a higher-end scenario. There is a 90% chance that the actual value will be less than or equal to this percentile, or conversely, a 10% chance that it will exceed it. It represents a wetter or warmer scenario.
- Example: A 90th percentile rainfall forecast of 20 mm suggests that there is a 90% chance of receiving 20 mm or less of rain and a 10% chance of receiving more than 20 mm.
2.3.3 Understanding the Spread
The difference between the 10th and 90th percentiles indicates the spread or uncertainty within the forecast. A small spread suggests high confidence among the ensemble members, whereas a large spread indicates greater uncertainty.
Example:
- If the 10th percentile is 8 mm and the 90th percentile is 12 mm, the spread is 4 mm, indicating that most ensemble members agree on the expected rainfall amount.
- If the 10th percentile is 2 mm and the 90th percentile is 20 mm, the spread is 18 mm, indicating significant uncertainty in the forecast.
In terms of planning, this is valuable information to have because knowing the spread helps you judge the likelihood of specific condition occurring. For example, if no rain is predicted in the 10th percentile, and 1mm is predicted in the 90th percentile, there’s a reasonable chance you’ll see some rain in the forecast timeline, but it is very unlikely to be a significant amount that would stop activities. On the other hand, if 10mm of rainfall were predicted in the 10th percentile, and 25mm in the 90th, there is a very high probability of enough rain to impact many planned activities.
2.4 Practical Applications of Percentiles
Percentiles in weather forecasts provide valuable information for planning and decision-making across various sectors.
2.4.1 Risk Assessment
By understanding the range of possible outcomes, users can assess the risks associated with different weather scenarios. For example:
- Flood Risk: If the 90th percentile rainfall forecast is significantly higher than the median, there is a potential risk of heavy rainfall leading to flooding.
- Drought Planning: A low 10th percentile in precipitation forecasts may indicate the possibility of very dry conditions, prompting measures to conserve water.
2.4.2 Resource Allocation
Organizations can allocate resources more effectively by considering the range of possible weather conditions.
- Agriculture: Farmers can plan irrigation schedules, planting, and harvesting based on the likelihood of rainfall or temperature extremes.
- Energy Sector: Utilities can anticipate demand fluctuations due to temperature variations and adjust energy production accordingly.
2.4.3 Emergency Preparedness
Emergency services can use percentile information to prepare for extreme weather events.
- Disaster Response: High percentiles indicating severe weather conditions can trigger preemptive actions, such as evacuations or resource staging.
- Public Warnings: Communicating the potential for extreme conditions helps the public take necessary precautions.
2.5 Limitations and Considerations
While percentiles provide valuable insights, it’s important to be aware of their limitations.
2.5.1 Model Biases and Errors
Ensemble models are subject to biases and errors inherent in the modeling process, such as inaccuracies in initial conditions or simplifications in representing atmospheric processes. These factors can affect the reliability of the percentiles.
2.5.2 Interpretation Challenges
Percentiles represent probabilities, not certainties. Users must interpret them within the context of probability and understand that low-probability events can still occur.
2.5.3 Communication
Effectively communicating percentile information can be challenging, especially to non-expert audiences. Misinterpretation can lead to either complacency or unnecessary alarm.
Example: A 90th percentile indicating a low chance of extreme rainfall might be misinterpreted as an assurance that heavy rain will not occur, whereas there is still a 10% chance that it could.
2.6 Case Studies: Using Percentiles in Forecasting
2.6.1 Theoretical Case Study
Consider a scenario where a city is preparing for a potential heavy rainfall event.
- Forecast Data:
- 10th Percentile Rainfall: 30 mm
- 50th Percentile Rainfall: 50 mm
- 90th Percentile Rainfall: 80 mm
- Interpretation:
- There is a 10% chance that rainfall will be 30 mm or less.
- The most likely outcome is 50 mm of rainfall, with a 50% chance.
- There is a 10% chance that rainfall will exceed 80 mm.
- The spread between the highest and lowest prediction is quite wide, meaning that there is some uncertainty in the models, and it would be wise to prepare for all scenarios.
- Actionable Insights:
- Risk of Flooding: Since the 90th percentile is relatively high, there is a significant risk of heavy rainfall that could lead to flooding.
- Emergency Services: Should prepare for the possibility of extreme rainfall, even if it’s not the most probable outcome.
- Public Communication: Inform the public about the potential for heavy rain and advise on precautionary measures.
2.6.2 Real-World Case Study using our Online Tool
In this example, let’s look at a real example from the rainfall percentiles included in this online tool using the 48-hour predicted precipitation for the Fargo, ND region.
50th Percentile Prediction:
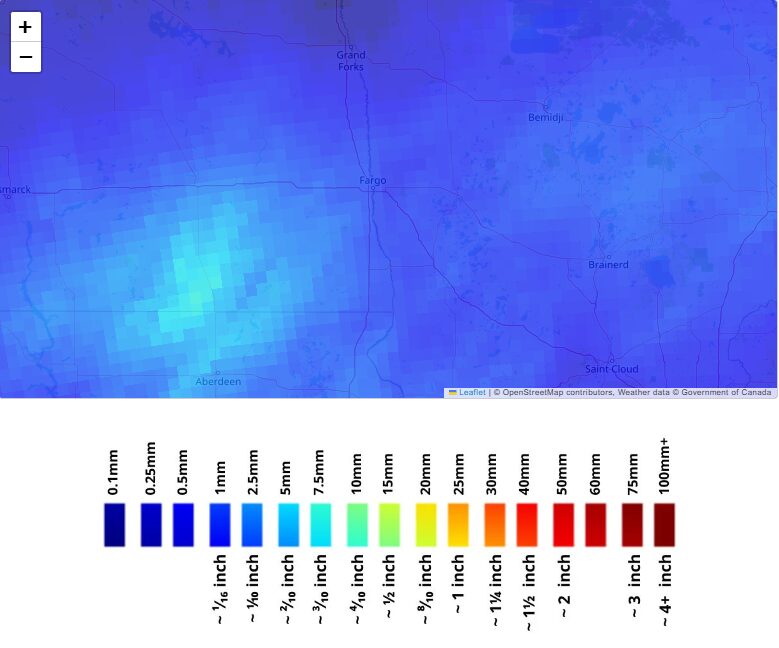
Interpretation:
- The 50th percentile prediction shows a likelihood of around 1mm to 2.5mm of precipitation for the Fargo region, with areas to the south-west likely to receive more (around 5mm to 7.5mm)
- This means that half the models predict more, and half predict less than this amount
10th Percentile Prediction
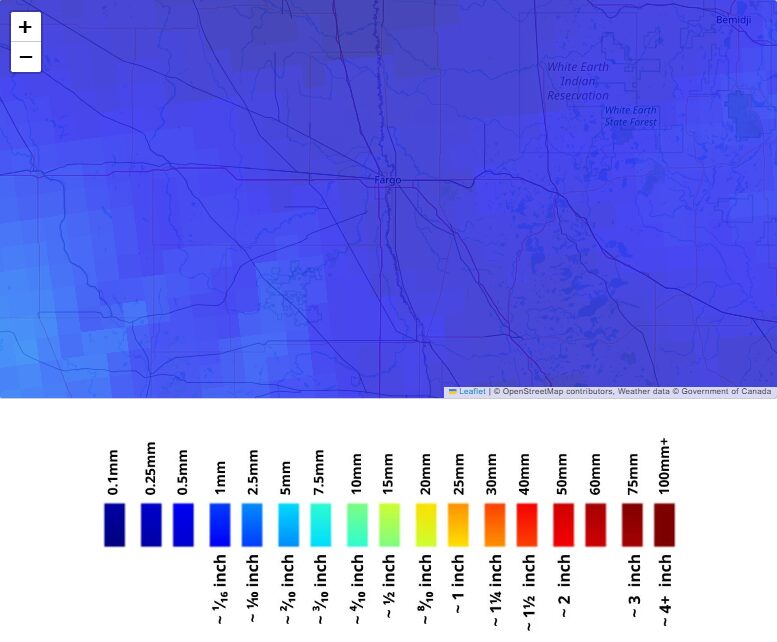
Interpretation:
- Darker blues indicate predictions of around 0.1mm to 0.25mm for the same region
- This means that 90% of models predict at least this much precipitation over the next 48-hours
90th Percentile Prediction:
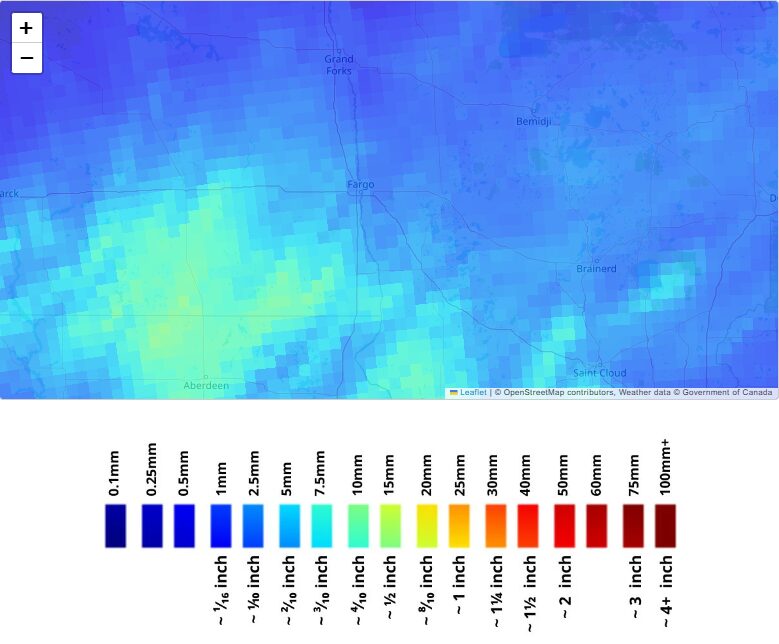
Interpretation:
- Lighter blue shades in the immediate Fargo vicinity predict precipitation amounts of around 2.5mm to 5mm, with the region to the south-west predicted to receive 10mm to 15mm
- This means that 10% of models predict these amounts of precipitation
Using this Information:
- As all percentiles predict precipitation over the next 48 hours, it is highly likely some will occur
- Outdoor events or activities should be planned assuming there will be some rain
- The most likely amounts are those shown in the 50th percentile. In the immediate Fargo area there likely won’t be a significant impact, but those in the region to the south-west may receive sufficient rainfall to impact certain activities
- There’s also a small chance of more significant precipitation, particularly in the region to the south-west, and users here should be prepared for this possibility
2.7 Best Practices for Using Percentiles
2.7.1 Consider the Full Range and the Spread
Look at multiple percentiles to understand the complete picture of possible outcomes. Focusing solely on the median can overlook significant risks. When the spread is fairly tight, this suggests higher confidence in the models, and the 50th percentile prediction probably has a strong likelihood of playing out. Where the spread is wider, while the 50th percentile is still the most likely outcome, the chances of significantly higher or lower amounts are greater.
2.7.2 Contextualize the Data
Interpret percentiles within the context of local conditions and historical data. What constitutes extreme weather in one region may be normal in another.
2.7.3 Combine with Other Forecast Information
Use percentiles alongside other forecast data, such as probability of exceedance, to enhance decision-making.
2.7.4 Update Regularly
Weather forecasts are updated frequently. Regularly check for updates to ensure decisions are based on the most current information.
2.8 Conclusion
Percentiles are powerful tools in weather forecasting that provide insights into the range and likelihood of possible weather conditions. By representing the distribution of ensemble model outputs, percentiles help users understand the uncertainties inherent in weather prediction.
Key takeaways from this lesson include:
- Understanding Percentiles: Percentiles indicate the value below which a certain percentage of observations fall, offering a statistical view of forecast data.
- Interpreting Percentiles: The 10th, 50th, and 90th percentiles represent different points in the forecast distribution, corresponding to lower-end scenarios, the median, and higher-end scenarios, respectively.
- Assessing Uncertainty: The spread between percentiles reflects the level of confidence in the forecast and highlights potential variability.
- Practical Applications: Percentiles aid in risk assessment, resource allocation, and emergency preparedness across various sectors.
- Limitations: Awareness of model biases, interpretation challenges, and communication issues is essential for effective use of percentile information.
By understanding the interpretation of percentiles in weather forecasts, users can make more informed decisions, better manage risks, and optimize outcomes in the face of weather uncertainties.